 |Courtney Heelis · The Chelmsford, Ongar and Villages Market
Housing market report · October 2026
A housing market report for the Chelmsford post town (CM1, CM2 and CM3), Ongar (CM5), and the villages of Hatfield Heath (CM22) and Matching Green (CM17)
01
The twelve months to 30 September 2026
The middle of this market barely moved and the top of it thinned. The typical sale was £410,000, −1.8% on the twelve months before it, while the upper quartile fell 6.2% and the ninetieth percentile 7.4%. The drop in sales volume is a different matter: most of it is the record still filling, not homes failing to sell, and the tile below says so.
HM Land Registry Price Paid Data, Category A open-market sales only, for CM1, CM2 and CM3 on the Chelmsford post town, CM5 on the Ongar post town, and the Hatfield Heath (CM22) and Matching Green (CM17) localities. 1 October 2025 to 30 September 2026 against 1 October 2024 to 30 September 2025. Repossessions, portfolio buy-to-lets and transfers under a power of sale are Category B and are excluded. Downloaded 30 October 2026. Every percentage change on this page is this report’s own arithmetic on two figures in its own tables.
21 of the 2,279 sales are in the two villages, under one percent of the total. Every combined figure in sections 01 to 06 is therefore a Chelmsford figure in all but name. The villages are reported separately in section 07 and section 08, and the district blocks in section 09 keep them apart, because a village instruction cannot be priced off a city median.
02
1 October 2025 to 30 September 2026
Read down the change column and the pattern is consistent: the further up the price distribution you go, the more the figure fell. The lower quartile gave up 3.1%, the median 1.8%, the upper quartile 6.2% and the ninetieth percentile 7.4%.
| Figure | Oct 2025 – Sep 2026 | Oct 2024 – Sep 2025 | Change |
|---|---|---|---|
| Sales | 2,279 | 3,077 | −25.9% |
| Median | £410,000 | £417,500 | −1.8% |
| Mean | £446,041 | £469,107 | −4.9% |
| Lower quartile | £315,000 | £325,000 | −3.1% |
| Upper quartile | £525,000 | £560,000 | −6.2% |
| 90th percentile | £685,000 | £740,000 | −7.4% |
| Highest | £3,800,000 | £2,425,000 | +56.7% |
| Lowest | £75,000 | £72,900 | +2.9% |
HM Land Registry Price Paid Data, Category A sales, downloaded 30 October 2026. Changes are this report’s own arithmetic on the two columns beside them.
Highest, +56.7%. That is one sale. A detached house on Little Laver Road in Matching Green registered at £3,800,000 in October 2025, against a top sale of £2,425,000 the year before. One transaction is a single observation and cannot describe a market. It is in the table because the table reports what the data holds, not because the top of this market rose by half.
Sales, −25.9%. The comparison base is contaminated. March 2025 alone carries 504 registrations against 205 in January and 95 in April, and 487 of those 504 were second-hand homes rather than new build. That peak sits inside the Oct 2024 – Sep 2025 column. It coincides in time with the end of the temporary stamp duty thresholds on 31 March 2025; this data cannot establish that one caused the other, and no such claim is made here. What it does mean is plain enough: any fall measured against that year is overstated.
The mean sale over these twelve months was £446,041. The median was £410,000. The gap of about £36,041 is not a rounding difference and it is not noise — it is the shape of the market showing through the arithmetic.
A mean adds every price together and divides by the number of sales, so a single large transaction pulls it upward and nothing pulls it back. This patch registered a £3,800,000 house and 12 sales above £1,500,000 in twelve months. Those few homes lift the mean for everybody and describe almost nobody. The median ignores them. It is the price of the middle sale of 2,279 when you line them all up, so it moves only when the middle of the market moves.
That is why every headline in this report is a median. If you are weighing an asking price, the median is the figure that answers the question you are actually asking.
New-build registrations in this patch ran between 7 and 29 a month through the whole of the previous twelve months, and then fall to zero from January 2026 onward — nine consecutive months with no new-build sale recorded anywhere in Chelmsford, Ongar or the villages.
A patch of this size does not stop building in a single month. New-build titles are registered later than second-hand ones, often substantially later, so this is lag in that stream of the record and not a signal about construction or about new-build demand. The 1.1% above is printed for completeness and should not be quoted. It also appears in the list of things this report does not tell you, in section 11.
03
July to September 2026
Before the table, the thing that governs how to read it.
HM Land Registry records a sale when the transfer is registered, not when it completes. Registration follows completion by a gap that varies from weeks to many months, so the most recent months in any extract are always still filling. They are not short of sales; they are short of paperwork.
The monthly counts in this very extract show it. September 2026 carries 87 registrations. August carries 182 and July 191. Through 2025 the patch ran at roughly 250 a month. September 2026 is not a month in which Chelmsford nearly stopped selling houses — it is a month that has barely begun to arrive.
This quarter’s volume will rise. Every figure below that depends on a count is provisional and will move upward in the next edition. The prices are steadier than the counts, because the sales that have registered are a sample of the quarter rather than a biased slice of it, but even they should be treated as indicative.
| Figure | Jul – Sep 2026 | Jul – Sep 2025 | Change |
|---|---|---|---|
| Sales | 460 | 799 | −42.4% |
| Median | £421,500 | £425,000 | −0.8% |
| Mean | £437,069 | £477,403 | −8.4% |
| Lower quartile | £320,000 | £325,000 | −1.5% |
| Upper quartile | £515,000 | £570,000 | −9.6% |
| 90th percentile | £651,000 | £776,000 | −16.1% |
HM Land Registry Price Paid Data, Category A sales, downloaded 30 October 2026. Both quarters are affected by registration lag; the 2026 quarter very much more so. Changes are this report’s own arithmetic.
It shows that the prices being registered in the second half of 2026 are close to those registered a year earlier in the middle of the distribution. The quarterly median of £421,500 is −0.8% on the same quarter last year, which on a part quarter is no distance at all.
It shows the same top-end thinning that section 02 found over the full year. The quarterly upper quartile is −9.6% and the ninetieth percentile −16.1%, both larger movements than the median. Two independent windows — the full twelve months and this quarter — point the same way, which is why this report treats the top-end softening as a pattern rather than a single reading.
It does not show a turn in the market, and this report will not claim one. The volume change of −42.4% is a registration artefact and nothing more. A part quarter cannot carry a conclusion about direction: the sales that have reached the register are the ones that completed earliest and were conveyed fastest, and there is no way from this data to know how the rest differ. Anyone reading −42% and reaching for the word crash is reading a filing queue, not a housing market. Ask again in February, when the quarter is complete.
| Month | Sales registered |
|---|---|
| 2025-10 | 283 |
| 2025-11 | 250 |
| 2025-12 | 238 |
| 2026-01 | 158 |
| 2026-02 | 186 |
| 2026-03 | 200 |
| 2026-04 | 181 |
| 2026-05 | 164 |
| 2026-06 | 159 |
| 2026-07 | 191 |
| 2026-08 | 182 |
| 2026-09 | 87 |
The same Land Registry extract, counted by month of transfer. The decline from January 2026 is the shape of an incomplete record, not of a market.
04
Calendar years 2019 to 2026
Over eight calendar years the median moved from £355,000 to £415,000, a rise of about 17% across six years. Annual volume over the same period swung between 2,573 and 4,018. Volume is the larger story, and it is also the figure the record distorts most.
| Year | Sales | Median | Mean | Lower quartile | Upper quartile |
|---|---|---|---|---|---|
| 2019 | 3,034 | £355,000 | £399,830 | £280,000 | £480,000 |
| 2020 | 2,721 | £382,500 | £426,219 | £295,000 | £505,000 |
| 2021 | 4,018 | £385,000 | £436,843 | £302,000 | £520,000 |
| 2022 | 3,473 | £405,000 | £456,183 | £310,000 | £550,000 |
| 2023 | 2,573 | £400,000 | £445,971 | £300,000 | £535,000 |
| 2024 | 2,624 | £400,000 | £448,540 | £315,000 | £530,000 |
| 2025 | 3,043 | £415,000 | £464,192 | £320,000 | £555,000 |
| 2026 (part year, to 30 Sep) | 1,508 | £408,125 | £442,202 | £315,000 | £520,000 |
HM Land Registry Price Paid Data, Category A sales, downloaded 30 October 2026. The 2026 row is shaded and labelled because it covers nine months to 30 September and is still filling. It is not comparable with the complete years above it.
Sales registered a year. 2026 is drawn open-topped — no cap on the bar — because the year runs only to 30 September and the record is still filling. Its true height is unknown and higher than shown. Figures above each bar come from the table above.
| Period | Sales | Median |
|---|---|---|
| 2019 H1 | 1,400 | £347,250 |
| 2019 H2 | 1,634 | £360,000 |
| 2020 H1 | 1,028 | £360,000 |
| 2020 H2 | 1,693 | £395,000 |
| 2021 H1 | 2,544 | £385,000 |
| 2021 H2 | 1,474 | £385,000 |
| 2022 H1 | 1,636 | £394,000 |
| 2022 H2 | 1,837 | £415,500 |
| 2023 H1 | 1,133 | £390,000 |
| 2023 H2 | 1,440 | £405,000 |
| 2024 H1 | 1,107 | £385,000 |
| 2024 H2 | 1,517 | £411,000 |
| 2025 H1 | 1,473 | £415,000 |
| 2025 H2 | 1,570 | £419,000 |
| 2026 H1 | 1,048 | £400,000 |
| 2026 H2 (part period) | 460 | £421,500 |
Same source. The final row covers July to September 2026 only, a part period, and is shaded accordingly. Its median of £421,500 rests on 460 sales.
The price series here is unexciting, and that is the finding. Half-year medians have sat in a band between £347,250 and £421,500 since 2021. Through four years of rate rises, a stamp duty change and a good deal of commentary, the middle of this market moved within about −5% to +5% and no further.
Volume did not behave anything like as calmly. The patch registered 4,018 sales in 2021 and 2,573 in 2023, a fall of 36% in two years, with the median essentially unchanged between those years — £385,000 against £400,000. What changed was how many people moved, not what a house was worth.
For a seller that distinction matters more than it sounds. A thin market is not a cheap market. It is a market in which the right buyer exists but takes longer to find, which is an argument about marketing reach and patience rather than about price.
Registration lag depresses 2026 throughout this section, so the apparent volume decline at the right-hand end of the chart is an artefact. Treat the 2026 row and bar as a floor rather than a measurement. Nowhere in this report is an incomplete period presented as a decline.
05
The last twelve months, whole of market
Four property types, four very different prices, and one divergence in the change column that is the most useful thing in this report.
| Type | Sales | Share | Median | Mean | Lower quartile | Upper quartile | Median change |
|---|---|---|---|---|---|---|---|
| Detached | 701 | 30.8% | £577,500 | £640,737 | £476,500 | £725,000 | −3.8% |
| Semi-detached | 648 | 28.4% | £425,500 | £441,112 | £367,500 | £490,000 | +0.1% |
| Terraced | 500 | 21.9% | £358,750 | £375,268 | £320,000 | £410,000 | −0.3% |
| Flat / maisonette | 430 | 18.9% | £220,000 | £218,366 | £183,125 | £256,500 | −0.7% |
HM Land Registry Price Paid Data, Category A sales, downloaded 30 October 2026. Shares and median changes are this report’s own arithmetic. Land Registry’s “other” category, which covers non-standard titles, is not shown separately where it carries no sales.
Median sale price by property type, twelve months to 30 September 2026. Figures from the table above.
Honest answer: this data cannot separate them, and anyone who tells you otherwise is guessing.
What can be said is that the evidence points partly at composition. Across the whole patch the lower quartile fell 3.1% while the upper quartile fell 6.2% and the ninetieth percentile 7.4%. A uniform repricing moves all three together. A change in what happened to sell moves the top ones and leaves the bottom alone, which is what we see. Detached registrations are also the slowest to arrive, so the 701 detached sales in this window are the most incomplete of the four groups.
The practical reading: do not take −3.8% to a vendor as the amount their detached house has lost. Take it as evidence that fewer large houses cleared the market this year, and that pricing a large house needs its own comparables rather than a district median.
06
The last twelve months
Nine sales in ten are below £750,000. Above that the market does not taper — it falls off a shelf.
| Band | Sales | Share of all sales |
|---|---|---|
| Under £500,000 | 1,595 | 70.0% |
| £500,000 to £750,000 | 503 | 22.1% |
| £750,000 to £1m | 134 | 5.9% |
| £1m to £1.5m | 35 | 1.5% |
| £1.5m to £2m | 8 | 0.4% |
| £2m and above | 4 | 0.2% |
HM Land Registry Price Paid Data, Category A sales, twelve months to 30 September 2026, 2,279 sales. Shares are this report’s own arithmetic and sum to 100% give or take rounding.
70.0% of sales were under £500,000 and a further 22.1% fell between £500,000 and £750,000. That is 92.1% of the whole market inside one band of £750,000. Buyer depth below three quarters of a million is enormous, and a home priced in that range is competing for attention rather than waiting for a rare buyer.
Above it the counts collapse: 134 sales between £750,000 and £1,000,000, 35 between £1,000,000 and £1,500,000, and 12 in the whole patch above £1,500,000 in twelve months. Above a million and a half you are not in a price band, you are in a queue of about one buyer a month.
The practical consequence is about band edges. A guide price set just over a round number asks every buyer to clear a threshold that most of them will not clear, and the pool on the far side is a fraction of the pool just below. Where a house could credibly be guided either side of £750,000, the honest arithmetic is that below it the home sits among 2,098 comparable transactions a year and above it among 134. That is not an argument for underpricing. It is an argument for knowing which side of the shelf you have chosen, and why.
The three bands above a million rest on 35, 8 and 4 sales. Those are counts you can hold in your head, not distributions. They describe which particular houses happened to change hands and should never be turned into a rate of change.
07
A measurement from a second source
Start with what the primary source cannot do. HM Land Registry Price Paid Data carries no floor area. Not for any sale, anywhere. No rate per square foot in this report is computed from the dataset every other figure comes from, and any report that claims one from Land Registry alone has quietly imported it from somewhere else.
A measured local rate does exist, from a named second source, and it is printed below. PropertyData matches Land Registry price paid records to EPC floor areas and publishes the resulting rate by postcode district. These figures were pulled on 30 October 2026 over a twenty-four-month window. They are a measurement, not a model — but a measurement of a subset.
| District | Average | Middle 70% of sales | Sales matched | Window |
|---|---|---|---|---|
| CM1 — Chelmsford north and west | £428 | £347 – £516 | 1,617 | 2024-10-31 to 2026-09-25 |
| CM2 — Chelmsford south | £427 | £350 – £512 | 1,532 | 2024-10-31 to 2026-09-25 |
| CM3 — Chelmsford east and the rural fringe | £418 | £336 – £507 | 1,430 | 2024-10-31 to 2026-09-17 |
| CM5 — Ongar | £469 | £358 – £570 | 232 | 2024-10-31 to 2026-09-21 |
| CM22 — district around Bishop’s Stortford | £422 | £349 – £491 | 437 | 2024-10-31 to 2026-09-25 |
| CM17 — district around Harlow | £429 | £347 – £525 | 723 | 2024-10-31 to 2026-09-28 |
PropertyData, Land Registry price paid matched to EPC floor areas, 24-month window, pulled 30 October 2026. Districts, not the patch: CM1, CM2 and CM3 extend slightly beyond the Chelmsford post town, and CM22 and CM17 are whole districts.
Only sales with a matched EPC floor area are counted. Every rate above is a large sample and never a census. Homes with no EPC, with an EPC that could not be matched to the title, or with a floor area recorded incorrectly are simply absent. The sample sizes are in the table so you can see which rates are solid and which are not: CM1 rests on 1,617 matched sales, CM5 on 232.
Note also the spread. CM1’s average is £428, but the middle seventy percent of its sales ran from £347 to £516. A district average rate is a starting point for a conversation about a specific house, not a substitute for one.
Neither village can be given a rate per square foot. The matched samples at that scale are too small to publish, and this report will not manufacture one.
The CM22 and CM17 rows above are whole-district figures. CM22 is a district centred on Bishop’s Stortford and CM17 one centred on Harlow, including Harlow’s own housing stock. Hatfield Heath is a fraction of CM22 and Matching Green a fraction of CM17, and both are at the expensive, low-density end of their districts. Those two rows describe a different population from the villages and must not be read as the villages’ rate.
Set against that, the Chelmsford districts sit remarkably close together: £428, £427 and £418 a square foot across CM1, CM2 and CM3. Ongar is the outlier at £469, 10% above CM2, on the smallest sample of the four. Within Chelmsford itself, the price difference between districts is mostly a difference in how much house you get, not in what a foot of it costs.
08
Homes above £750,000, the last twelve months
181 sales at £750,000 or more, 7.9% of everything that sold. The segment is overwhelmingly detached houses, and its share of the market depends enormously on which part of this patch you stand in.
| Figure | Oct 2025 – Sep 2026 | Oct 2024 – Sep 2025 | Change |
|---|---|---|---|
| Sales | 181 | 299 | −39.5% |
| Median | £888,000 | £945,000 | −6.0% |
| Mean | £989,366 | £1,030,166 | −4.0% |
| Upper quartile | £1,000,000 | £1,160,000 | −13.8% |
| Lower quartile | £800,000 | £823,498 | — |
| 90th percentile | £1,330,000 | £1,350,000 | — |
| Highest | £3,800,000 | £2,425,000 | — |
HM Land Registry Price Paid Data, Category A sales at £750,000 and above. The volume change carries the same registration-lag and March-2025 warnings as section 02, and detached registrations — which are 163 of 181 sales here — arrive slowest of all.
| Type | Sales | Share of segment | Median |
|---|---|---|---|
| Detached | 163 | 90.1% | £900,000 |
| Semi-detached | 12 | 6.6% | £792,500 |
| Terraced | 6 | 3.3% | £880,000 |
Same source and window. Shares are this report’s own arithmetic on the segment total of 181. No flat or maisonette in this patch reached £750,000 in the period. The semi-detached and terraced rows rest on 12 and 6 sales and are anecdotes rather than medians.
| Year | All sales | At £750,000+ | Share |
|---|---|---|---|
| 2019 | 3,034 | 174 | 5.7% |
| 2020 | 2,721 | 184 | 6.8% |
| 2021 | 4,018 | 305 | 7.6% |
| 2022 | 3,473 | 311 | 9.0% |
| 2023 | 2,573 | 226 | 8.8% |
| 2024 | 2,624 | 221 | 8.4% |
| 2025 | 3,043 | 296 | 9.7% |
| 2026 (part year) | 1,508 | 110 | 7.3% |
Same source. The 2026 row is a part year to 30 September and is shaded. Shares are this report’s own arithmetic on the two columns beside them.
Stated plainly: the share roughly doubled between 2019 and 2025, from 5.7% to 9.7%. In 2019 about one sale in eighteen cleared £750,000; by 2025 it was about one in ten.
£750,000 in 2019 is not £750,000 in 2026. The threshold is a fixed cash figure while the whole market moved up underneath it, so a good part of that doubling is homes crossing a stationary line rather than the top of the market growing. The patch median rose from £355,000 to £415,000 over the same years, which on its own lifts a slice of ordinary houses over the mark.
The early years are thin as well as distorted: 174 qualifying sales in 2019 and 184 in 2020. Treat those shares as rough. The trend direction is real; the magnitude is not a growth rate for the top of the market.
| Area | All sales | At £750,000+ | Share of its own sales |
|---|---|---|---|
| CM2 | 738 | 36 | 4.9% |
| CM1 | 737 | 50 | 6.8% |
| CM3 | 677 | 66 | 9.7% |
| CM5 | 106 | 18 | 17.0% |
| Hatfield Heath | 14 | 5 | 35.7% |
| Matching Green | 7 | 6 | 85.7% |
Same source and window. Shares are this report’s own arithmetic.
In a Chelmsford-weighted patch this segment is a much smaller share than in the villages, and the gap is not marginal. In CM2 4.9% of sales cleared £750,000. In CM3 it was 9.7%, in Ongar 17.0%. In Hatfield Heath 35.7% and in Matching Green 85.7%.
What that means in practice is simple and worth saying out loud. The combined figures at the top of this report are Chelmsford figures. A £750,000 house is an unusual event in CM2 and an ordinary one in Matching Green. Pricing a village house off the patch median would be a mistake in one direction, and pricing a Chelmsford flat off the village end would be a mistake in the other.
85.7% rests on 6 sales out of 7. Hatfield Heath’s 35.7% rests on 5 out of 14.
Those are not rates. They describe who happened to sell in two small villages in one twelve-month window, and one more or one fewer large sale would move them by double digits. They are printed because the direction is real and useful — these villages genuinely sit at the top of the patch — but neither number should ever be quoted as a percentage to a vendor.
| Street | Locality | Postcode | Date registered | Type | Price |
|---|---|---|---|---|---|
| Little Laver Road | Matching Green | CM17 0RJ | 2025-10-31 | Detached | £3,800,000 |
| Main Road | Rettendon Common | CM3 8DW | 2026-06-12 | Detached | £2,390,000 |
| London Road | Widford | CM2 8TE | 2025-10-30 | Detached | £2,000,000 |
| Common Lane | Little Baddow | CM3 4RY | 2026-05-29 | Detached | £2,000,000 |
| Mill Lane | Little Baddow | CM3 4SB | 2026-01-30 | Detached | £1,950,000 |
| Potash Road | Matching Green | CM17 0RN | 2026-02-19 | Detached | £1,900,000 |
| Named property, no street recorded | Good Easter | CM1 4RU | 2026-04-24 | Detached | £1,800,000 |
| London Road | Stanford Rivers | CM5 9PH | 2026-01-19 | Detached | £1,700,000 |
| Sandford Mill Road | Chelmer Village | CM2 6NT | 2026-06-29 | Detached | £1,660,000 |
| Cherry Garden Lane | Danbury | CM3 4QY | 2026-04-09 | Detached | £1,650,000 |
| Shardelow Avenue | Chelmsford Garden | CM1 6BG | 2025-11-21 | Detached | £1,607,500 |
| North Hill | Little Baddow | CM3 4TQ | 2025-11-21 | Detached | £1,500,000 |
HM Land Registry Price Paid Data, Category A sales, twelve months to 30 September 2026. House names are on the public record and are deliberately not printed here. One row is a named property with no street recorded against it; its locality and postcode are shown and the street cell is left empty rather than filled with a guess. Dates are registration dates, not completion dates.
09
County, region, country and the towns next door
Two comparisons follow and they are not the same kind of comparison. Read the warning before the first table, because the figures either side of it are not measuring the same thing.
Every headline figure in this report is a median of actual Category A sales. The UK House Price Index figures below are averages produced by a statistical model that adjusts for the mix of properties sold. They are different statistics, computed differently, over different populations, and published to different dates — ours to 30 September 2026, the index to 1 August 2026.
So the relationship between our £410,000 and the comparators below is an order of magnitude, not a precise multiple. It is fair to say this patch sits above the England average and a little above the Essex average. It is not fair to say it sits 1.40 times England, and this report does not.
| Area | Average price | Annual change |
|---|---|---|
| United Kingdom | £273,037 | 0.9% |
| England | £293,525 | 0.4% |
| East of England | £337,848 | 0.2% |
| Essex | £359,433 | -0.3% |
| Chelmsford | £376,682 | -2.4% |
| Uttlesford | £468,166 | 0.1% |
| Epping Forest | £530,653 | -0.3% |
| Harlow | £317,453 | 4.3% |
HM Land Registry UK House Price Index, Average-prices file for August 2026, downloaded 30 October 2026. Local authority rows are included because this patch straddles four of them: Chelmsford, Epping Forest (Ongar), Uttlesford (Hatfield Heath) and Harlow (Matching Green). Annual change is the index’s own figure, not ours.
This second comparison is like for like. Both columns below are medians of Category A sales over the same twelve months, drawn from the same Land Registry files, computed the same way. The only difference is the geography.
| Type | This patch | Essex | Essex sales | Patch against Essex |
|---|---|---|---|---|
| Detached | £577,500 | £515,000 | 5,607 | +12% |
| Semi-detached | £425,500 | £375,000 | 5,394 | +13% |
| Terraced | £358,750 | £325,000 | 3,951 | +10% |
| Flat / maisonette | £220,000 | £205,000 | 2,613 | +7% |
HM Land Registry Price Paid Data, Category A sales, 1 October 2025 to 30 September 2026, county of Essex as recorded in the Land Registry county field (17,565 sales). The final column is this report’s own arithmetic on the two columns beside it. Note that this patch is itself part of Essex, so the comparison is a part against its whole.
The patch sits above the county on every type, and by the widest margin on detached homes. That is the county’s coastal and northern towns pulling the Essex figure down rather than Chelmsford being exceptional; section 07 found the rate per square foot across CM1, CM2 and CM3 sitting within a few pounds of one another, which is not the signature of a premium market.
| Post town | Sales | Median |
|---|---|---|
| Brentwood | 965 | £498,000 |
| Ongar (CM5) | 106 | £492,500 |
| Billericay | 517 | £480,000 |
| Great Dunmow | 400 | £450,000 |
| Bishop's Stortford | 733 | £440,000 |
| Chelmsford (post town, CM1-CM3) | 2,152 | £402,500 |
| Maldon | 420 | £375,000 |
| Harlow | 885 | £342,500 |
| Braintree | 768 | £335,000 |
| Basildon | 1,126 | £330,000 |
| Witham | 486 | £325,000 |
| Colchester | 2,871 | £325,000 |
HM Land Registry Price Paid Data, Category A sales, same window and same definition throughout, by the Land Registry post town field. The Chelmsford and Ongar rows are this report’s own patch definitions; the rest are whole post towns. Post towns are postal geography and do not follow local authority boundaries.
Chelmsford south, with Great Baddow, Galleywood, Chelmer Village and Sandon
Chelmsford north and west, with Springfield, Broomfield, Writtle, Roxwell and Good Easter
Chelmsford east and the rural fringe, out to Danbury, South Woodham Ferrers, Mayland and North Fambridge
The Ongar area, reaching High Ongar, Fyfield, the Rodings and the Lavers
A single village in CM22, on the Bishop’s Stortford post town
A single village in CM17, on the Harlow post town
HM Land Registry Price Paid Data, Category A sales, twelve months to 30 September 2026. Median changes are against the same twelve months a year earlier and are this report’s own arithmetic. Type rows show the sale count and the median for that type.
Chelmsford and Ongar together registered 2,258 sales in the last twelve months at a median of £410,000. Hatfield Heath and Matching Green together registered 21, at a median of £760,000 — higher by about 85%, on 21 sales.
That village median is built from 21 transactions. It is reported because the gap is real and matters to anyone valuing a house in either village, and it is kept separate because averaging it into the Chelmsford figure would hide both. The combined patch median of £410,000 that opens this report is, for all practical purposes, the Chelmsford median: the villages are 21 sales out of 2,279.
10
What the patch covers
A schematic, not a survey. It shows which districts this report covers and roughly how they sit against each other, and nothing more precise than that.
The most important thing on that diagram is the size of CM3, and the fact that it is not a Chelmsford suburb. It carries a Chelmsford postal address and it runs from Boreham and Danbury out through Hatfield Peverel to South Woodham Ferrers, Mayland, Latchingdon, Althorne and North Fambridge — coastal and rural Essex, closer in character to the Crouch estuary than to the city centre. CM3 registered 677 sales in the last twelve months at a median of £440,000, the highest of the three Chelmsford districts, and 9.7% of them cleared £750,000. A Chelmsford median applied to a house in Little Baddow or Danbury will mislead.
CM5 is the same point in a smaller district. Ongar is the post town, but the district reaches High Ongar, Fyfield, Stanford Rivers, Moreton, the Rodings and the Lavers — villages and farmland in Epping Forest district, where the UK House Price Index average is £530,653, the highest of the four local authorities this patch touches.
CM1 and CM2 are the city proper, north and south, and they are the two districts where the word Chelmsford does most of the work. Even there the edges are rural: CM1 includes Writtle, Roxwell and Good Easter.
The two village entries are deliberately drawn as parts of their districts rather than as the districts themselves. This report covers Hatfield Heath, not CM22, and Matching Green, not CM17. The only figures here that cover whole CM22 and CM17 are the rates per square foot in section 07, which are labelled as district rates for exactly that reason.
11
How this was built, and what it cannot do
Every figure in this report traces to a named file downloaded on a stated date. The limits are set out here rather than left for someone else to find.
HM Land Registry Price Paid Data, the yearly files for 2019 to 2026, downloaded 30 October 2026. The latest transfer date present in the 2026 file is 30 September 2026, and that is this report’s data cut-off.
Category A sales only. Land Registry marks each record A or B. Category A is a standard open-market sale at full market value. Category B covers repossessions, portfolio buy-to-lets, transfers under a power of sale, and other transfers that are not arm’s-length sales. Every Category B record is excluded from every figure here. A record with no price or no date is also excluded; neither appears anywhere in this report.
From the post town and locality labels Land Registry actually carries, not from assumption. The districts were checked against the data before any figure was computed:
“The Ridings” does not appear anywhere in this data as a settlement, a locality or a post town. It is a road name, and there are two candidates near this patch:
Neither is reported as a market and neither has been folded into any figure above. 8 sales and 20 sales across nearly eight years cannot carry a median that anyone should act on, and guessing which road was meant would put a fabricated geography on the face of a report whose whole value is that it does not do that. Courtney can tell us which was intended and the next edition will carry it properly.
Land Registry records a sale when it is registered, not when it completes. The gap runs from weeks to many months and is longer for new-build titles and, on this evidence, for larger detached houses. The consequence is that the most recent months of any extract are incomplete, always. In this extract September 2026 holds 87 registrations against a 2025 run rate near 250, and no new-build sale at all is recorded in the patch after April 2026.
Three things follow, and they are applied throughout this report. Part periods are shaded and labelled. The part year in the volume chart is drawn open-topped. And no recent decline in a count is presented as a fall in the market.
Where a percentage is this report’s own arithmetic on two figures in its own tables, it is ours and not a published statistic. That covers every year-on-year change, every share of a total, every price-band percentage, every high-value share, and the patch-against-Essex column in section 09. The underlying counts and medians are always printed beside them so the arithmetic can be checked. The only figures here that are published as computed by someone else are the UK House Price Index averages and annual changes in section 09, and the rates per square foot in section 07.
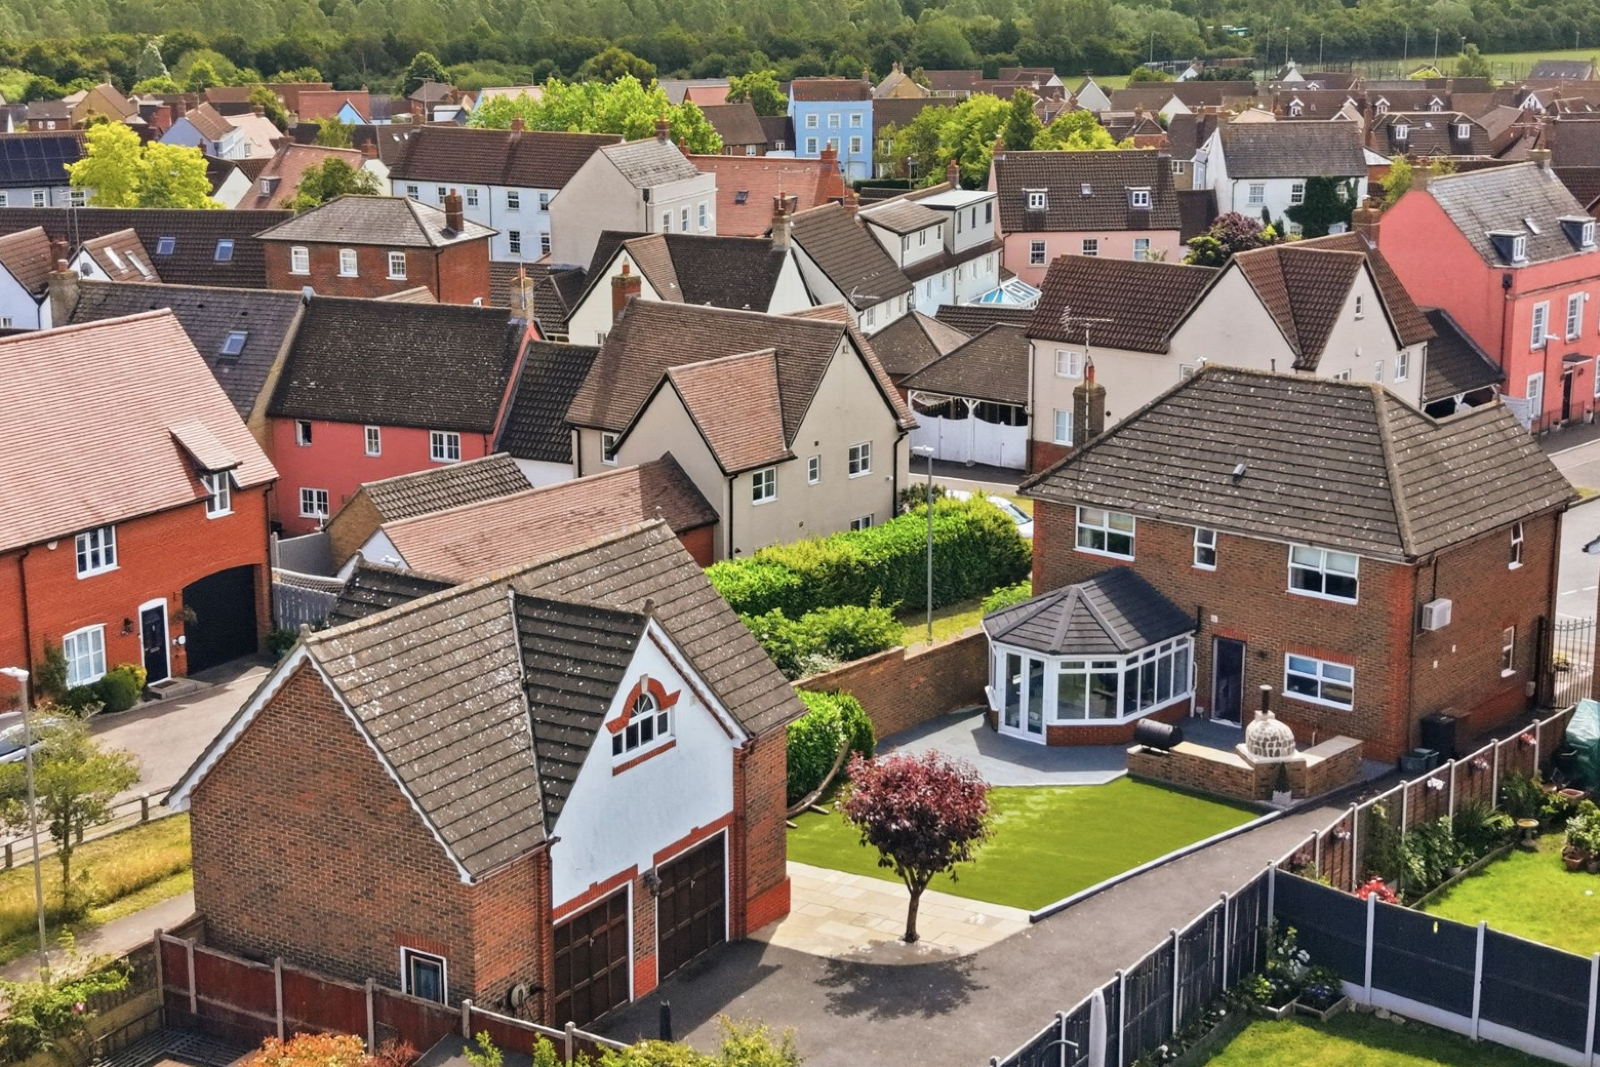
pp-2019.csv … pp-2025.csv).Both HM Land Registry datasets are published under the Open Government Licence and contain Crown copyright and database right material. Price Paid Data and the UK House Price Index are © Crown copyright and database right 2026. The cover photograph is a drone image over Albra Mead, Chelmsford Garden Community, captured 10 June 2026 and used unaltered.
12
Where a report stops being useful
This report describes 2,279 sales in twelve months, and 22,994 since January 2019. It cannot tell you what your own house is worth.
That is not modesty. It is what a median is. The figure of £410,000 at the top of this report is the middle of a distribution that runs from £75,000 to £3,800,000, and it contains no information at all about the condition of your kitchen, which way your garden faces, what the survey will say about the roof, or whether the right buyer for your particular house is looking this month. Section 05 showed that even the direction of travel differs by property type. Section 09 showed that two villages in this patch sell at a different level from the city they post their letters through.
What a report like this is genuinely good for is the question behind the question. Whether the market will carry a particular guide price. Whether a band edge is worth sitting under. Whether a quiet three months is the market or the filing queue — which, this quarter, it mostly is. Those are answerable, and the numbers above are how you answer them.
The rest needs someone standing in the house. If you would like that conversation, ask.
Who wrote this
Independent estate agent, brokered by eXp
muvin.co.uk — Muvin’s website
Published by Muvin, 30 October 2026. Courtney Heelis is an independent estate agent, brokered by eXp. Data to 30 September 2026; HM Land Registry files downloaded 30 October 2026.
This report is market commentary built from public data. It is not a valuation, not an offer, and not financial or legal advice. Figures are as recorded by HM Land Registry at the date of download and will change as later sales are registered.